價格:免費
更新日期:2016-10-22
檔案大小:47.9 MB
目前版本:10
版本需求:需要 iOS 8.0 或以上版本。與 iPhone、iPad 及 iPod touch 相容。
支援語言:丹麥文, 俄文, 加泰羅尼亞文, 匈牙利文, 印尼文, 土耳其文, 希伯來文, 希臘文, 德語, 捷克文, 斯洛伐克文, 日語, 法文, 波蘭文, 烏克蘭文, 瑞典文, 簡體中文, 繁體中文, 羅馬尼亞文, 義大利文, 芬蘭文, 英語, 荷蘭文, 葡萄牙文, 西班牙文, 阿拉伯文, 韓語, 克羅埃西亞文, 泰文, 馬來亞拉姆文

Visualize, trend, track and compare the state of the world's children broken down by factors of age, gender, education, layout, marriage and more.
Have friends whose statements about these topics doesn't sound right? Use the app to show them the real data. Use our dataset to change their mindset.
Tools:
======
Compare unlimited countries over time by simply clicking their flags
6 different chart types
3D options for Pie charts
Export your custom charts for use in other projects
Email charts
Rotate and render
Reports:
======
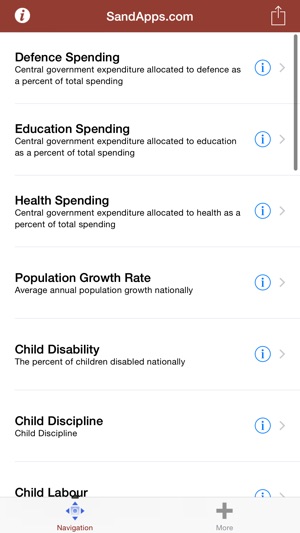
Central government expenditure allocated to defense as a percent of total spending
Central government expenditure allocated to education as a percent of total spending
Central government expenditure allocated to health as a percent of total spending
Average annual population growth nationally
The percent of children disabled nationally
Child Discipline
The percent of children 5-14 involved in labour
The percent of children married
The number of children orphaned by AIDS
The number of children orphaned by any cause
Early initiation of breastfeeding (within one hour of birth)
Net attendance ratio of girls to boys in primary education
Net attendance ratio of girls to boys in secondary education
Net enrollment ratio of girls to boys in primary education
Net enrollment ratio of girls to boys in secondary education
Net enrollment/attendance rate in primary education
Boys Net attendance ratio in primary education (NAR)
Girls Net attendance ratio in primary education (NAR)
Boys Net attendance ratio in secondary education
Girls Net attendance ratio in secondary education
Boys Net enrollment ratio in primary education (NER)
Girls Net enrollment ratio in primary education (NER)
Boys Net enrollment ratio in secondary education
Girls Net enrollment ratio in secondary education
Countries/Areas:
============
Albania
Algeria
Angola
Argentina
Asia
Australia
Austria
Azerbaijan
Bahamas
Bahrain
Bangladesh
Belarus
Belgium
Belize
Benin
Bhutan
Bolivia
Botswana
Brazil
Bulgaria
Burkina Faso
Burundi
CEE/CIS and Baltic States
Cameroon
Canada
Chad
Chile
China
Colombia
Congo
Congo Dem. Rep.
Costa Rica
Croatia
Cuba
Cyprus
Czech Republic
Denmark
Developing countries
Dominican Republic
East Asia and Pacific
Ecuador
Egypt
El Salvador
Estonia
Ethiopia
Fiji
Finland
France
Gambia The
Georgia
Germany
Ghana
Greece
Grenada
Guatemala
Honduras
Hungary
Iceland

India
Indonesia
Industrialized countries
Iran
Ireland
Israel
Italy
Jamaica
Japan
Jordan
Kazakhstan
Kenya
Korea Rep
Kuwait
Kyrgyzstan
Latin America and Caribbean
Latvia
Least developed countries
Lebanon
Lesotho
Liberia
Lithuania
Luxembourg
Madagascar
Malawi
Malaysia
Maldives
Mali
Malta
Mauritania
Mauritius
Mexico
Middle East and North Africa
Mongolia
Morocco
Mozambique
Myanmar
Namibia
Nepal
Netherlands
New Zealand
Nicaragua
Nigeria
Norway
Oman
Pakistan
Panama
Paraguay
Peru
Philippines
Poland
Portugal
Republic of Moldova
Romania
Russian Federation
Rwanda
San Marino
Saudi Arabia
Senegal
Seychelles
Sierra Leone
Singapore
Slovakia
Slovenia
Somalia
South Asia
Spain
Sri Lanka
St Vincent and the Grenadines
Sudan
Swaziland
Sweden
Switzerland
Tajikistan
Tanzania
Thailand
Togo
Tonga
Trinidad and Tobago
Tunisia
Turkey
Uganda
Ukraine
United Arab Emirates
United Kingdom
United States of America
Uruguay
Venezuela
Vietnam
World
Yemen
Zambia
Zimbabwe
Source:
=======
Data provided by member nations to the United Nations.

Requires an active network.
支援平台:iPhone, iPad
